
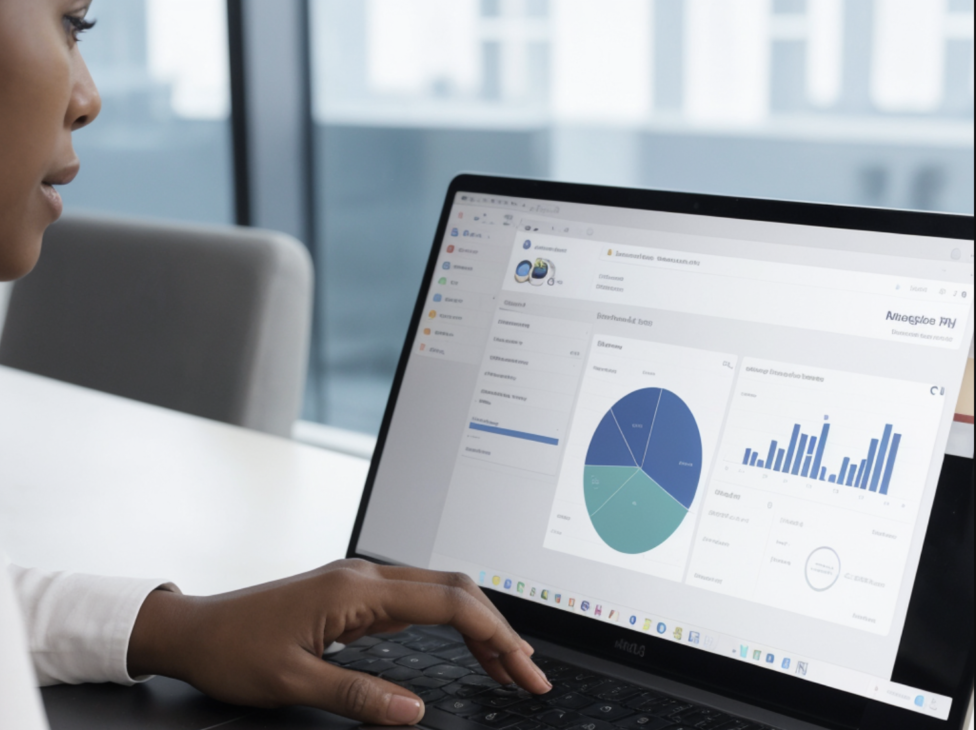
Designing dashboards that help people make decisions
Dashboards bring together the information people need to work towards specific goals. They support quick, informed monitoring and better decisions in fields such as business, finance, education, healthcare and sport. This article looks at the essentials of effective dashboard design, including the choice of metrics, charts and layouts that make data easier to understand.
1. What dashboards are for
A dashboard is more than a screen full of data. It is an interface that presents the metrics and key performance indicators needed to monitor different parts of an organisation. It provides an overview at a glance, helping managers and stakeholders respond promptly and make decisions informed by data.
2. Choosing the right metrics
Selecting metrics: The choice of metrics is fundamental. They need to be relevant, meaningful, actionable and comparable, and aligned with the company’s strategic goals. If the aim is to monitor operational efficiency, for example, cycle time, defect rates and customer satisfaction may be important measures.
- For a financial dashboard, measures such as return on investment, profitability and profit margin are essential. Too many metrics can overwhelm people; too few can leave them without the information they need. The level of detail also matters. Choose between an overview and a detailed view according to the audience.
3. Choosing the right charts
Selecting charts: Charts are a useful way to reveal patterns and trends. The right format depends on the data and the insight you want to communicate.
- Bar and line charts, for example, can present data clearly and make it easy to read. Pie charts are popular but can be misleading when they contain too many categories, so use them carefully. Charts should be consistent, clear and engaging. Avoid formats that distort interpretation, such as 3D charts or overly complex stacked charts.
4. Building an effective layout
Organising the layout: A dashboard layout should make information easy to navigate and understand. Grids, headings and sidebars help organise the data visually.
- A sales dashboard might use a sidebar for filters and selectors, with the main area showing sales trends over time and comparisons between regions. Use a grid to align elements consistently and whitespace to prevent clutter. Filters and selectors let people tailor the view and explore the data in more depth.
5. Design practices that make dashboards useful
Design and usability fundamentals: Dashboard design should make the interface easy to use and the data easy to understand. This includes using colour to guide attention and keeping visual elements restrained to avoid information overload.
- For example, contrasting colours can help distinguish positive and negative performance: green for indicators on target and red for alerts below expectations. Each colour should have a clear, predefined purpose, helping people interpret the data rather than simply decorating the screen.
Integration and interaction: A dashboard should not be static. Filtering by time period or market segment, or drilling down into more detailed information, makes it more useful and adaptable to individual needs.
- A sales dashboard might let someone click a quarterly sales chart to see monthly or weekly figures. That detail should be available when needed without compromising clarity or performance. Usability testing is essential to establish whether the interactions are intuitive and useful.
6. Keeping dashboards relevant
Ongoing review and adjustment: Dashboards need regular reviews to remain relevant and accurate. Update the metrics as business goals change, and check data integrity so decisions rely on accurate, current information.
- For example, review data sources quarterly and check whether the metrics still reflect the company’s intended KPIs. Keep a record of changes so users understand what has changed and how it may affect their analysis.
7. Supporting collaboration
Shared understanding and strategic alignment: Good dashboards help teams communicate and collaborate. Sharing them across an organisation can create a common understanding and align decisions between departments.
- An operations dashboard shared with production, sales and marketing can help coordinate work and adjust stock levels to demand. Manage access permissions carefully to protect sensitive information while making useful information available to the people who need it.
Closing thoughts
Well-designed dashboards do more than make large amounts of data easier to view. They help people act quickly and with sound information. Careful choices about metrics, charts and layout allow organisations to get more value from their dashboards.